1. Your app is automatically available for mobile devices
1. View your app on your mobile device: Download Salesforce1 from Apple app store & explore using this quick tour: https://developer.salesforce.com/trailhead/salesforce1_mobile_app/salesforce1_mobile_app_intro
2. Enhance Your App with Components
Lightning Component & App Builder:
Ingest a Component from AppExchange
- Go here: https:// appexchange .salesforce.com/ components (or Google AppExchange Components)
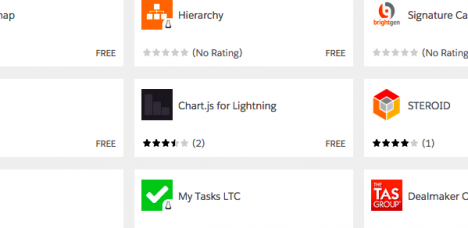
Look for “Chart.js for Lightning”
- Click More
- Read about it. Go to details. We will use it to insert beautiful and responsive HTML5 based chart into our app based on Conference data.
![]()
Click Get it Now button
- Click Log In To The AppExchange (if you’re prompted)
- Click Install in Production
- Check this checkbox: I have read and agree to the terms and conditions .
- Click Confirm and Install (if it prompts you, put in your org credentials)
- Click Install for All Users and Click the Install button
Put it to use:
- Reference this literature on how to use Chart.js: js for Lightning – Getting Started (originally found in AppExchange page details)
- Precursor – set-up the App Builder for this exersise:
- Click Setup & go to Lightning App Builder on left-hand navigation
- Click New
- Choose your template (take a look at the different options) – pick One Column
- Click Next – give it a label & click Finish
- Click ChartsJS (that’s the component we downloaded)
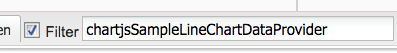
- Click Filter List – Choose Sessions as Object (right hand side)

- Click Rich Text – type any concluding remarks here (use the stylist on right-hand pane)

- Set up Lightning Components to render your data:
- Go to your ChartJS Component, observe it relies on an Apex Data Provider class name & Chart title:
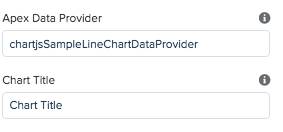
- Update the Chart Title: “Session Comparison”
- Click Save & Click Activate – name it “Session Success”
- Open up your phone for testing:
- Go to your Salesforce1
- Find your app!
- Explore it and click around! Click on chart itself & click items on Filered List
- Make sure you click the Chart values to see it render differently to give you better views
![]()
Render your chart with your business data:
- Remember the Apex Provider Class? It was: chartjsSampleLineChartDataProvider
- Take a look at it! Go to your Developer Console under your name:

- Go to File >> Open >> Find your class – paste this in under search: chartjsSampleLineChartDataProvider
– Observe what it’s doing by default!
– Find your X axis! You’ll see a snippet of default code:
– chartjsData.labels = new list<string>{‘Jan’,’Feb’,’Mar’,’Apr’,’May’,’Jun’,’Jul’};
– Find your coordinates:
– Notice every time there is a new dataset, it will be plotted on the graph. Snippets:
– dataset.data = new list<integer>{65, 59, 80, 81, 56, 55, 40};
– dataset.data = new list<integer>{28, 48, 40, 19, 86, 27, 90};
– Notice everything else (the RGBA coloring, the dataset labels, etc)
– Notice the last line where we serialize our datasets into JSON content that will be dynamically rendered at our Lightning App Builder
– return JSON.serialize(chartjsData);
- What will we solve?
- Let’s see the breakdown on how many Beginner vs Intermediate vs Advanced session we have
- Let’s compare this year’s breakdown with next year’s
- Let’s utilize 3 different views to gain better insight into data:
- Line is an original and default view
- Bar will gauge simple categorical differences as based above
- Radar will provide complex insight on overall number of sessions difference between years while pointing out differences in session levels
– Solution
– Get this github code: http://bit.ly/1MOAGop
– Create a new Apex Class: go to Developer Console >> File >> New >> Apex Class
– Give it a name: chartMySessions
– Paste the GitHub code in
- Observe it
- Note the labels:
- label = ‘This Year’;
- Note our data:
- data = new list<integer>{in15_beginner, in15_intermediate, in15_advanced};
- Note Next Year’s dataset – manually provided for example-sake:
- data = new list<integer>{3, 8, 9}; // Example data set of advanced Sessions on the rise for next year
- Note the labels:
This workshop has been created by Arastun “Russ” Efendiyev. Find other tools from Russ at: https://github.com/shtooney?tab=repositories
1,119 total views, 1 today